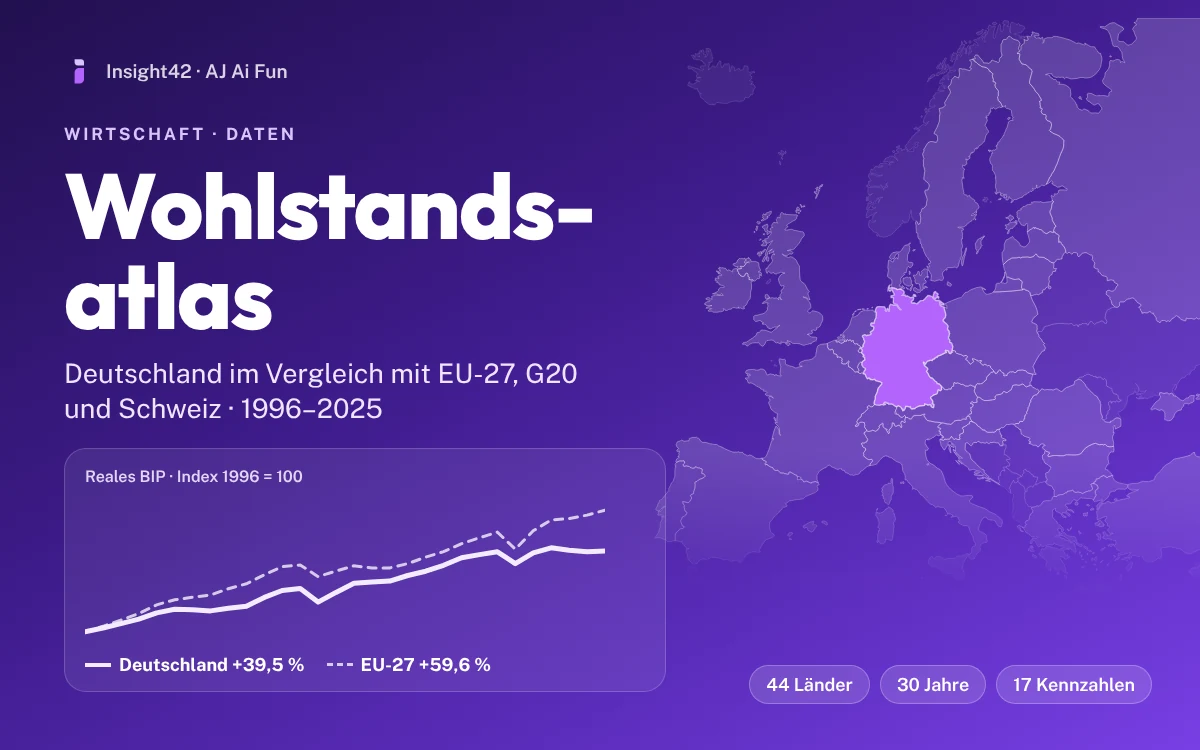
Prosperity Atlas Germany
Interactive atlas for 44 countries: GDP, income tax, social contributions, tax burden, home ownership, wealth, pensions and prices from 1996 to 2025. Pick countries straight on the map.
Like: 0Share: 0
Explore
Experiment 04 · Production simulation
Three of five lines are blocked this morning, and none of the blockers is on the shop floor. Open the lab, read the decision queue, release a held lot or reserve a road transfer, and watch the gate dates recalculate. The 3D study, the parts table, the warehouse and the map share one selection, so a click on a part takes you to its lot, its route and its evidence.
What you can explore
A ranked queue of what blocks a gate, why, what it affects and the one action that changes the date. Buttons simulate the action and recalculate every forecast.
Inspect an aircraft, a part, a lot, a shipment or a source, or follow material from supplier to warehouse to transport to line to gate and see where it stops.
Quote a transfer between eleven sites over scheduled road, air and sea services, see the route on a world map or a globe, then reserve the stock.
The AI use case
From published drawings to a working planning page: the engines, the geometry and the scenario were built, audited and handed over in files an engineer can read.
Original approximate 3D studies of five aircraft, built from NASA three-view drawings and published dimensions; every assembly records what its source supports and what it does not.
A transport engine searches weekly services for up to three legs with payload and dimension checks; a production engine turns lots, orders and transfers into supply balances and gate forecasts. Both run without a page and are tested headless.
A module derives the ranked action list from the live scenario, and every section generates a 'What you see' paragraph from the current numbers, so the text stays true after each what-if.
One stylesheet with the house tokens, nine small scripts with their couplings written at the top, scenario data as JSON. Dark mode, phone layout, deep links and a JSON export of the changed scenario.
Three-view drawings and dimensions: NASA/TP-2007-213684 (NTRS 20070023367), NASA/TP-2002-210718 (SR-71A), NASA TM X-2933 (XB-70-1), NACA-AC-6 (Junkers F 13). NASA identifies the drawings as US government works with public use permitted.
Concorde: BAE Systems heritage, British Airways; no publisher drawing is reproduced, the model is an original study. Cargo screening logic: ANA Cargo 777-F specification.
Everything else is scenario data: packages, masses, stock, facilities, services, prices, durations and incidents are fictional planning estimates, not manufacturer or operator records. The Moon depot and the space services are fiction and off by default. Libraries: Three.js, D3, topojson-client (MIT/ISC).
Keep exploring
Interactive atlas for 44 countries: GDP, income tax, social contributions, tax burden, home ownership, wealth, pensions and prices from 1996 to 2025. Pick countries straight on the map.
A daily radar for Microsoft Azure Local: priorities, fixed bugs, security updates, dependencies and roadmap in one place.
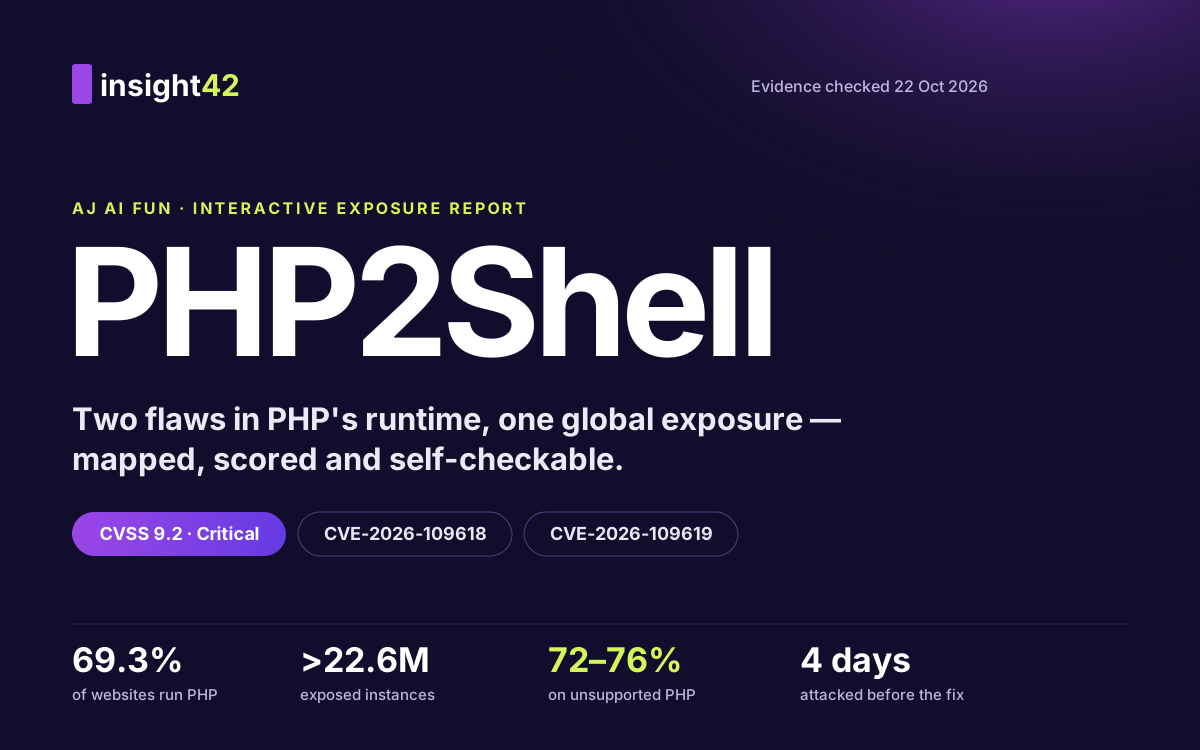
An interactive map of the PHP2Shell exposure — who is affected, how hard, and the small bugs behind it.
Your own production, stock and transport data could answer the same questions. We build planning tools, data platforms and AI that your team can run.