Azure Local Radar
A daily radar for Microsoft Azure Local: priorities, fixed bugs, security updates, dependencies and roadmap in one place.
Like: 0Share: 0
Explore
Economy · Data
We combined World Bank, Eurostat, OECD and IMF data with national statistics offices, UBS, the Bundesbank and the German pension reports into one country-year matrix: 44 countries, 30 years, 17 indicators. Every chart shows the values and the change per year, with the German governments from Kohl to Merz marked.
What you can explore
Click up to eight countries on the map of Europe or the world; every chart, ranking and heatmap follows. Germany and the EU-27 average are always shown.
Each indicator shows its level as a line and the yearly change as bars, in percent or percentage points, with the spread of all countries behind it.
Sourced values, own calculations and scenario models are labelled. Missing years stay empty instead of being filled in.
The AI use case
We pulled the official series first and checked every transfer against a checksum before any chart used it.
World Bank, Eurostat, OECD and IMF series for 44 countries, home-ownership figures from 14 national statistics offices, plus the UBS wealth reports, the Bundesbank household survey and the German pension reports.
Every series came in by API and was checked with a checksum. Control values for Germany were fetched again and matched exactly.
Two scenarios use real market data: half the income tax invested in the MSCI World, and 20 years of pension contributions invested in gold.
Map selector, line and bar charts, rankings and a heatmap. Every chart can be maximised and has an info button that explains it.
World Bank — World Development Indicators (GDP, growth, consumption per head)
Eurostat — taxes and social contributions, wage deductions, home ownership, household financial wealth, pensions, prices
OECD — Revenue Statistics and Taxing Wages (income tax and social contributions); IMF WoRLD and GFS for India, Russia, Saudi Arabia
National housing surveys and censuses for home ownership outside the EU (US Census Bureau, Statistics Canada, ABS, IBGE, Statistics Japan and others)
UBS — Global Wealth Report 2026 and Global Wealth Databook 2023
Deutsche Bundesbank — Private Households and their Finances (PHF) 2010–2023
German Federal Government — pension insurance reports 2022–2025
MSCI World Net Return EUR and gold prices in EUR (model calculations)
Keep exploring
A daily radar for Microsoft Azure Local: priorities, fixed bugs, security updates, dependencies and roadmap in one place.
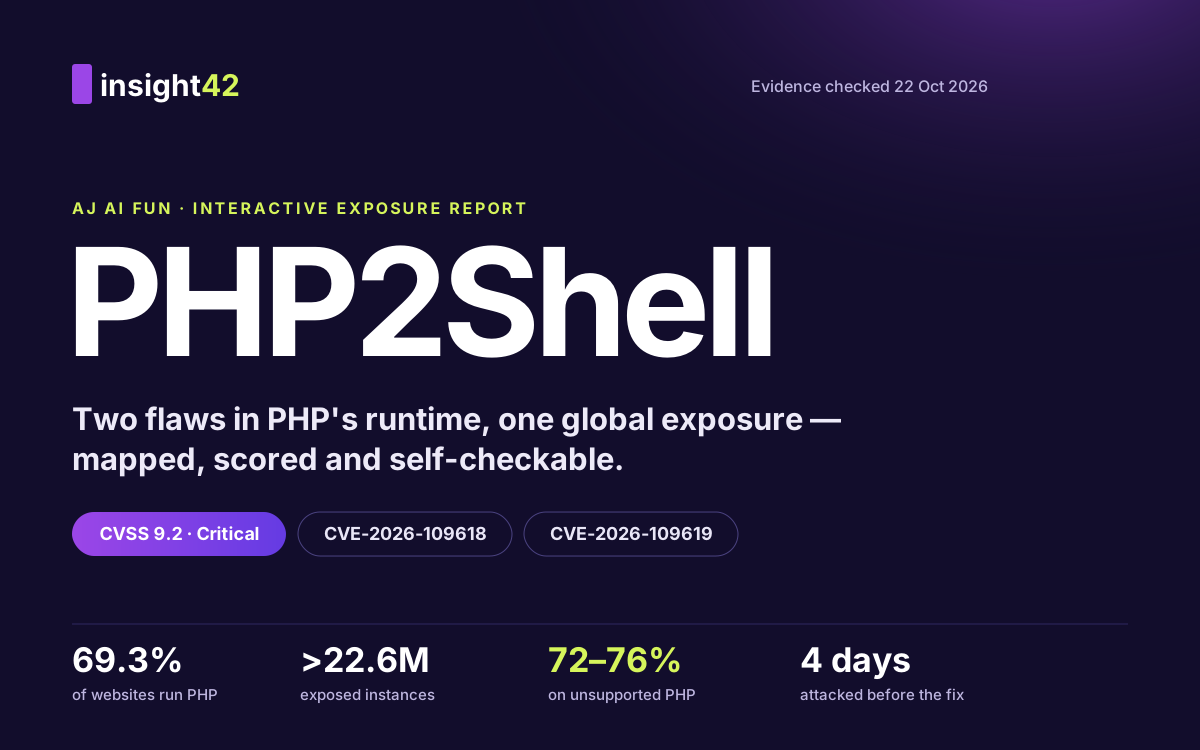
An interactive map of the PHP2Shell exposure — who is affected, how hard, and the small bugs behind it.
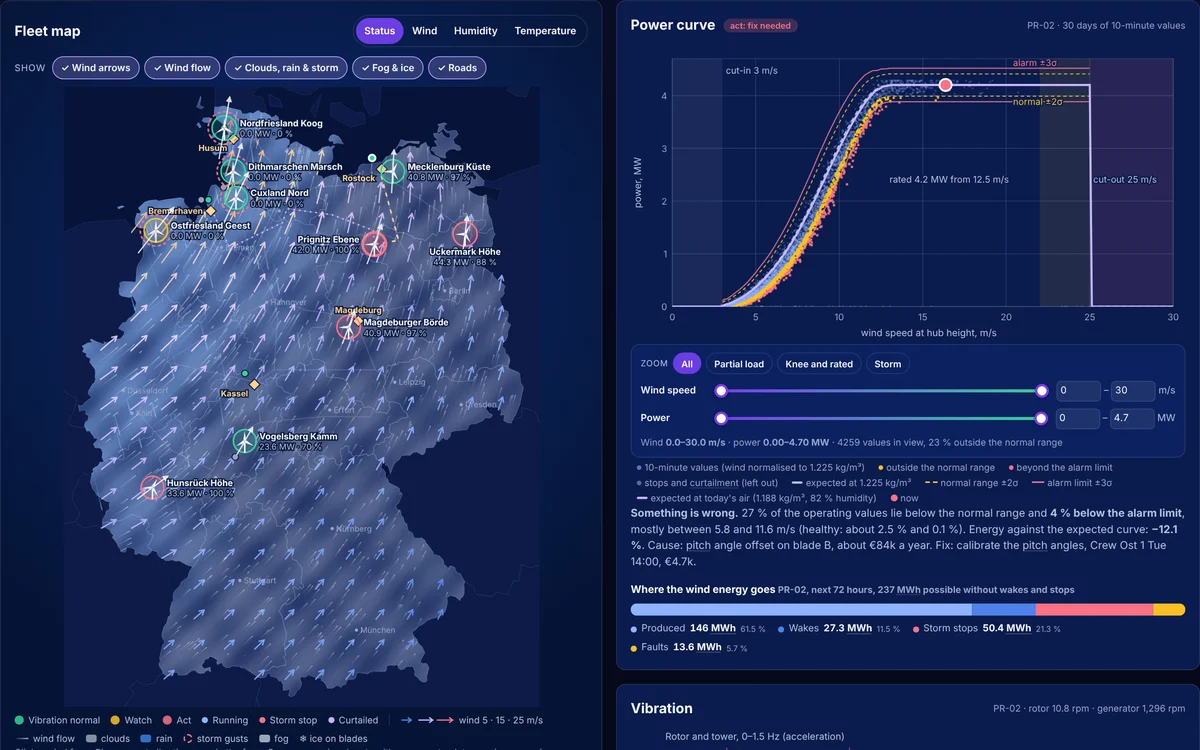
A fictional wind fleet across Germany with live DWD weather: power curves with alarm lines, vibration spectra, a 3D turbine that shows the faulty part, the chance of failure within 72 hours, real repair costs, spare parts, crews and road routes.
Want this view on your own data? We build data platforms and interactive reports that decision-makers actually use.