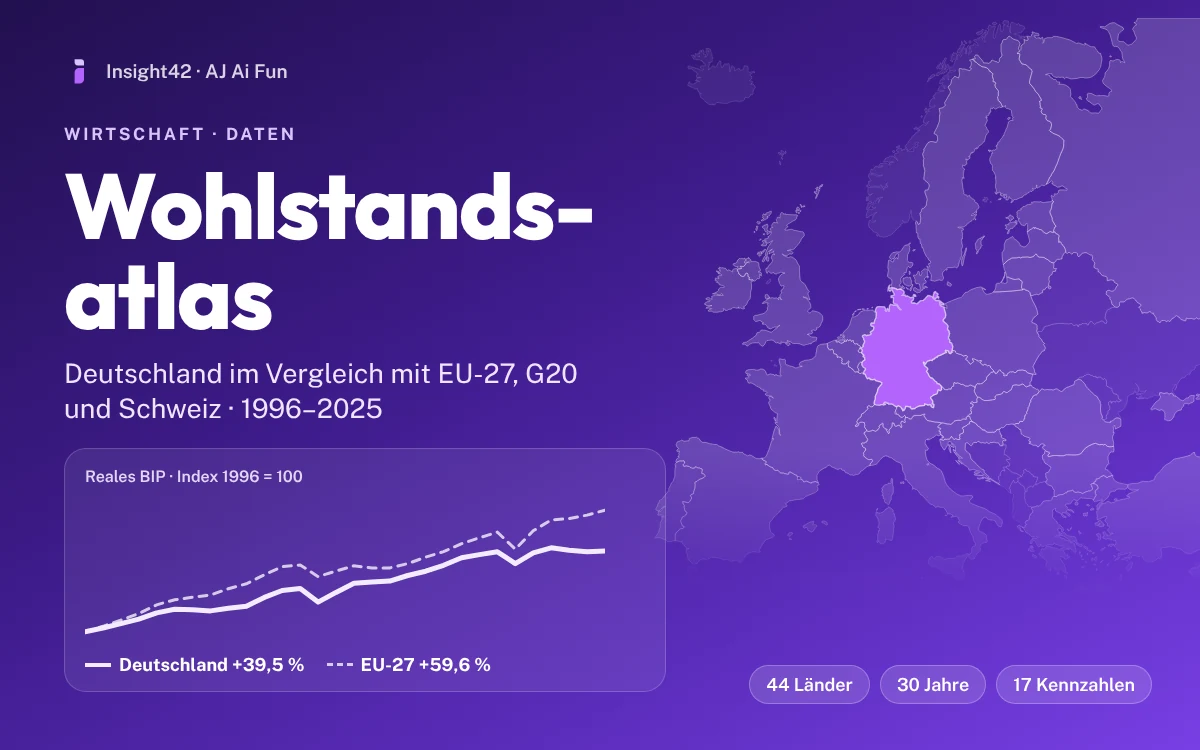
Prosperity Atlas Germany
Interactive atlas for 44 countries: GDP, income tax, social contributions, tax burden, home ownership, wealth, pensions and prices from 1996 to 2025. Pick countries straight on the map.
Like: 0Share: 0
Explore
Experiment 01 · Data Visualization
See how 236 countries and areas have aged from 1926 to 2026. Drag any country into the circle to see its population, deaths and births by age, then compare up to five countries across a century.
What you can explore
Population, deaths and births by 5-year age group for the country in the centre, men and women side by side.
Colour the world by age, children per woman, life expectancy, income, inequality, religion, homicides and healthcare.
Lock up to five countries and follow them from 1926 to 2026. See what goes with what across 195 countries.
The AI use case
From a question to a live app: AI-assisted engineering with every number traceable to an official source.
We defined the questions, measures and age groups with AI, then reviewed them against the UN definitions.
Raw files come from the official UN WPP 2024 package, World Bank and Gapminder, each pinned to a version and checksum.
A fast D3 app with accessible controls, data tables for every chart and honest labels for estimates and projections.
The pipeline checks for a new UN edition twice a year, so the atlas updates without a rebuild by hand.
United Nations, DESA, Population Division (2024). World Population Prospects 2024, CC BY 3.0 IGO. Estimates 1950–2023, projections 2024–2026.
GDP, income, Gini, income levels and religion: Gapminder, CC BY. Healthcare and homicide: World Bank World Development Indicators, CC BY 4.0.
1926–1949 is our own reconstruction: off by default and always marked.
Map: Natural Earth (public domain). Today's borders throughout; no position on disputed territories.
Keep exploring
Interactive atlas for 44 countries: GDP, income tax, social contributions, tax burden, home ownership, wealth, pensions and prices from 1996 to 2025. Pick countries straight on the map.
A daily radar for Microsoft Azure Local: priorities, fixed bugs, security updates, dependencies and roadmap in one place.

An interactive map of the PHP2Shell exposure — who is affected, how hard, and the small bugs behind it.
Want this kind of insight from your own data? We build data platforms, analytics and AI that your team can run.